Saratoga's August median rebounds to $4.43M as the $3M–$5M band carries half the month's 20 closings
The tension hiding inside a healthy median
August's headline number looks calm: a $4.43 million median, a tidy $82.2 million in volume, ten sales over asking. Look closer and the month fractures into two separate stories running in opposite directions. At the top of the market—four homes at $5 million or above—buyers paid a combined $952,250 over list on two of those sales and still accepted a $350,000 concession on a third. At the bottom, a single condominium sat 83 days before closing at a 1.6-percent discount. Everything in between, the $3M–$5M band that accounted for half the month's closings, moved briskly and mostly above ask. The high-end volatility and the mid-market discipline are not contradictions; they are the same market operating on different clocks.
Year-over-year comparison is not available—no confirmed closings were recorded for August of last year.
The month at a glance
| Metric | August 2026 |
|---|---|
| Closings | 20 |
| Median sale price | $4,434,444 |
| Median $/sq ft | $1,555 |
| Total volume | $82,164,254 |
| Low / High | $950,000 / $7,950,000 |
| Over list / At / Under | 10 / 2 / 8 |
| Median % of list | 100.4% |
Twenty closings produced $82.2 million in aggregate volume against a median of $4.43 million—a meaningful jump from July's $3.5 million median (25 closings) and the second-highest median in the six-month window. The overall median $/sq ft of $1,555 sits almost exactly at the six-month midpoint, suggesting the composition effect, rather than any underlying price shift, is doing most of the work: August brought a heavier concentration of larger, pricier single-family homes to close than July did.
The active inventory picture adds context. With 63 homes currently listed at a median asking price of $3,998,000 and 12 under contract, the pipeline remains well-stocked. The ratio of pending to active—roughly one in five—is neither a frenzy nor a stall.
Every sale this month
| Address | Segment | Beds | Sq Ft | List Price | Sale Price | % of List |
|---|---|---|---|---|---|---|
| 14810 Farwell Avenue | Single Family | 4 | 4,529 | $6,998,000 | $7,950,000 | 113.6% |
| 14634 Granite Way | Single Family | 4 | 3,371 | $5,450,000 | $6,300,000 | 115.6% |
| 14695 Horseshoe Drive | Single Family | 5 | 4,294 | $6,500,000 | $6,150,000 | 94.6% |
| 14300 Maclay Court | Single Family | 5 | 3,300 | $5,295,000 | $5,385,000 | 101.7% |
| 19241 Brockton Lane | Single Family | 5 | 2,664 | $4,698,000 | $4,900,000 | 104.3% |
| 19990 Blythe Court | Single Family | 4 | 2,699 | $4,398,000 | $4,709,250 | 107.1% |
| 20555 Carniel Avenue | Single Family | 4 | 2,749 | $4,295,000 | $4,701,116 | 109.5% |
| 20096 Chateau Drive | Single Family | 4 | 3,436 | $3,998,000 | $4,700,000 | 117.6% |
| 13090 Heath Street | Single Family | 8 | 3,572 | $4,650,000 | $4,550,000 | 97.8% |
| 14211 Juniper Lane | Single Family | 3 | 2,838 | $4,500,000 | $4,500,000 | 100.0% |
| 19922 Scotland Drive | Single Family | 3 | 2,249 | $3,998,000 | $4,368,888 | 109.3% |
| 13561 Myren Drive | Single Family | 6 | 2,526 | $3,998,000 | $3,850,000 | 96.3% |
| 13371 Quito Road | Single Family | 5 | 2,553 | $3,598,000 | $3,800,000 | 105.6% |
| 11980 Brookglen Drive | Single Family | 4 | 2,128 | $3,285,000 | $3,000,000 | 91.3% |
| 14111 Alta Vista Avenue | Single Family | 4 | 1,803 | $2,999,888 | $2,900,000 | 96.7% |
| 19150 Brookhaven Drive | Single Family | 3 | 1,320 | $2,425,000 | $2,425,000 | 100.0% |
| 17074 Bohlman Road | Single Family | 3 | 2,145 | $2,600,000 | $2,425,000 | 93.3% |
| 18570 Montpere Way | Single Family | 4 | 2,114 | $2,399,000 | $2,420,000 | 100.9% |
| 20019 Marigny Place | Single Family | 4 | 2,335 | $2,198,000 | $2,180,000 | 99.2% |
| 18944 Sara Park Circle | Condominium | 2 | 1,100 | $965,000 | $950,000 | 98.4% |
Four transactions that explain the month:
20096 Chateau Drive posted the month's largest premium in percentage terms: 117.6 percent of list, or $702,000 over a $3,998,000 ask. A 1955 vintage home with 3,436 square feet on a 15,232-square-foot lot, it closed at $1,367.87 per square foot—the lowest $/sq ft among homes that sold above list, which tells you buyers were chasing the lot and location, not the finishes.
14810 Farwell Avenue commanded the single largest nominal overbid: $952,000 above a $6,998,000 list, closing at $7,950,000. At $1,755 per square foot on 4,529 square feet with a full acre of land, this was the month's anchor transaction in both price and signal.
14634 Granite Way sold for $6,300,000 against a $5,450,000 ask—115.6 percent—in six days. At $1,869 per square foot it was the month's highest $/sq ft figure, underscoring that compact, well-positioned homes in the upper tier can be priced conservatively and still attract outsized competition.
13090 Heath Street is the counterweight. An 8-bedroom, 3,572-square-foot home sat 109 days before closing $100,000 below list. The extended marketing period (the longest of any DOM-reported sale this month) and the discount together suggest that unusual configurations—eight bedrooms in Saratoga is an outlier—require patient buyers and patient sellers.
Where the market split
By segment — With only one condominium sale, a segment median is not meaningful for that category; the range is $950,000 to $950,000 (one closing). Single-family figures below are drawn from 19 sales.
| Segment | Sales | Median Price | Median $/Sq Ft | Price Range |
|---|---|---|---|---|
| Single Family | 19 | $4,500,000 | $1,586 | $2,180,000–$7,950,000 |
| Condominium | 1 | — | $864 | $950,000 (one sale) |
The single-family segment carried everything. Its median of $4,500,000 sits $65,556 below the blended market median of $4,434,444—a small effect from the one condominium sale pulling the blended figure down slightly. The $/sq ft gap between the two segments is substantial: $1,586 for single-family versus $864 for the sole condo. That spread reflects both property type and the distinct market that exists below $1 million in a city where the typical single-family home now trades well above $4 million.
By price band — Ten of twenty closings fell in the $3M–$5M band, making it the structural backbone of the month.
| Price Band | Sales | Median Price | Median $/Sq Ft |
|---|---|---|---|
| Under $1M | 1 | $950,000 | $864 |
| $1M–$2M | 0 | — | — |
| $2M–$3M | 5 | $2,425,000 | $1,145 |
| $3M–$5M | 10 | $4,525,000 | $1,555 |
| $5M and up | 4 | $6,225,000 | $1,694 |
The $1M–$2M band recorded zero closings. That absence is notable given 63 active listings at a median ask of $3,998,000—the inventory skews well above that band—but it also reflects a structural gap in Saratoga's ownership profile. The city simply does not produce many transactions in that range, and August produced none.
The $5M-and-up band (four sales, median $6,225,000) showed the highest $/sq ft at $1,694—but also the widest outcome variance, ranging from $6,150,000 to $7,950,000 and spanning results from 94.6 percent to 115.6 percent of list. At this tier, individual property characteristics and buyer psychology swamp any sense of a uniform market.
Against asking
Of 20 closings, 10 sold above list, 2 at list, and 8 below. The median percent of list across all 20 sales was 100.4 percent—a figure that describes a market sitting almost exactly at equilibrium on paper while concealing a wide spread underneath.
The biggest premium was 117.6 percent (20096 Chateau Drive, $702,000 over ask). The biggest discount was 8.7 percent (11980 Brookglen Drive, $285,000 below a $3,285,000 list). The distance between those two outcomes—26.3 percentage points—reflects how sharply pricing discipline, or the absence of it, affects results even within the same month and the same general price range.
Seven of the ten over-list sales were clustered in the $3M–$5M band, where competition appears most reliable. The two sales at exactly list price both fell in that band as well—one a same-day closing (14211 Juniper Lane, DOM recorded as 0), suggesting a pre-negotiated or off-market arrangement that landed at the ask rather than above it.
Of the DOM-reported sales (9 out of 20, so interpret with caution), the median was 6 days. Five sold in under 7 days, one between 8 and 21 days, and three over 60 days. The three slow-movers—13090 Heath Street (109 days), 17074 Bohlman Road (79 days), and 18944 Sara Park Circle (83 days)—all closed below list, ranging from 1.6 to 6.7 percent under. The connection between extended time on market and sub-list outcomes is consistent, even in a small DOM sample.
Six months in context
| Month | Closings | Median Price | Median $/Sq Ft |
|---|---|---|---|
| March 2026 | 28 | $4,052,500 | $1,579 |
| April 2026 | 32 | $3,899,700 | $1,532 |
| May 2026 | 25 | $4,150,000 | $1,562 |
| June 2026 | 31 | $4,744,000 | $1,512 |
| July 2026 | 25 | $3,500,000 | $1,412 |
| August 2026 | 20 | $4,434,444 | $1,555 |
The six-month picture shows two things simultaneously: median prices oscillating in a roughly $900,000 band ($3.5M–$4.74M) with no clear directional trend, and closing volume declining from its spring peak. March and April together accounted for 60 closings; June and July, the summer pair, totaled 56; August alone dropped to 20.
The $/sq ft line is more interesting. It hit a six-month low in July at $1,412 and recovered to $1,555 in August—but $1,555 is still below March's $1,579 and roughly in line with the $1,532–$1,562 range of April and May. The $/sq ft metric, which controls for home size, suggests the underlying price per unit of space has been range-bound rather than trending in either direction over this window. The month-to-month swings in median price are largely compositional: which homes happen to close in a given month moves the median more than any broad pricing shift.
July's $3.5 million median was the anomaly, not August's $4.43 million. July skewed smaller and lower by composition. August's recovery does not require a bullish explanation.
What it means
For sellers: The data from these 20 closings rewards accurate initial pricing more than optimism. Ten of nineteen single-family sellers who priced correctly attracted competitive offers; eight who did not gave back an average of several percentage points and, in three cases, gave back months of carrying costs as well. Homes priced in the $3M–$5M range with updated finishes and standard configurations are moving in under a week. Homes with unusual footprints or that require buyer imagination are not. If your property is the latter, the 109-day outcome at Heath Street is the relevant comparable, not the Chateau Drive result.
For buyers: The $3M–$5M band is genuinely competitive. Seven of ten sales in that range closed above list, and the premiums were not trivial—$400,000 to $700,000 over ask in several cases. If your budget sits in that band, come prepared to move quickly and to write a clean offer; the DOM data (9 of 20 reported, so partial) shows the best houses are gone in days. Above $5 million, the range of outcomes is wide enough that price discovery is real: 14695 Horseshoe Drive, a 2025 build, closed 5.4 percent below its $6.5 million ask. There is room to negotiate at the top if the property has been sitting. Below $2.5 million, inventory is thin and the one condo that sold spent 83 days on market—patience and selective offers may work in your favor.
For owners not transacting: August's recovery from July's median trough should not be read as a new upward leg. The $/sq ft figure at $1,555 is essentially flat against the March–May range. Saratoga single-family values appear stable within a band, not accelerating. Owners who refinanced in the past two years or who are watching for a selling window should note that the market is absorbing 20–32 closings per month at these price levels with no sign of distress—but also no sign of a demand surge that would push $/sq ft meaningfully above the six-month ceiling.
Tim McMullen · Tim McMullen, Broker · CA DRE #02016832
[email protected] · (415) 691-9272
More from Saratoga
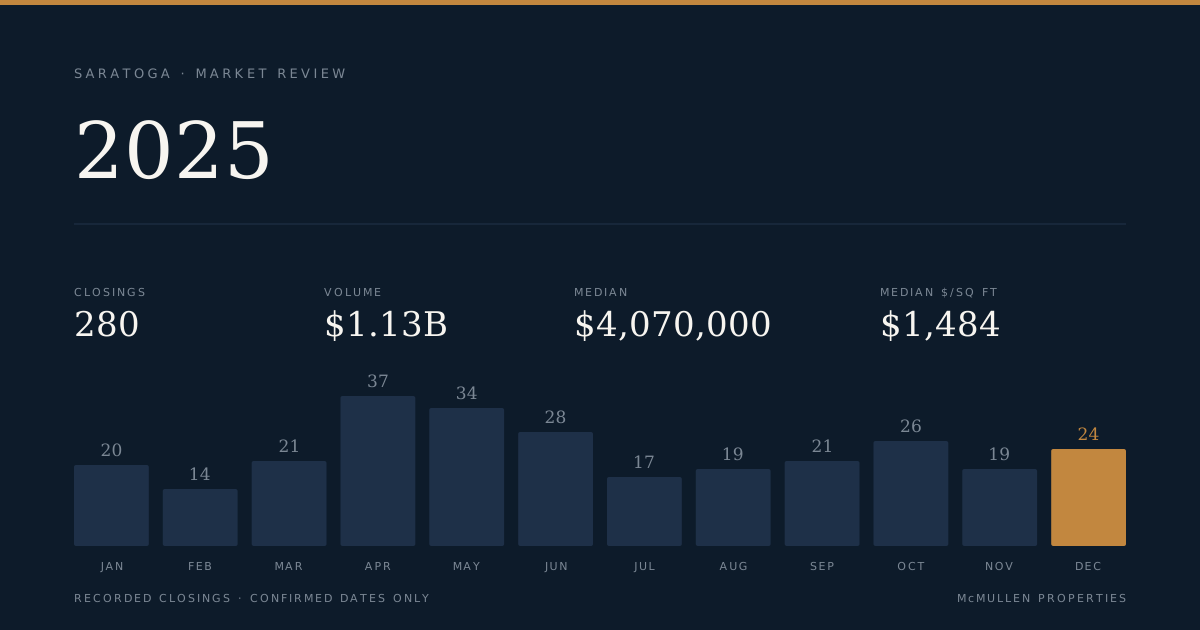
Saratoga's 280 Closings in 2025 Totaled $1.13 Billion, With a $20M Ranch Setting the Ceiling
A full year of transaction records — 280 closings across single-family, townhouse, and condominium segments — shows a market with a $4.07M overall median, a pace split sharply between homes that closed in under a week and those that sat past 60 days, and a price-per-square-foot inversion above $5M that repays close reading.
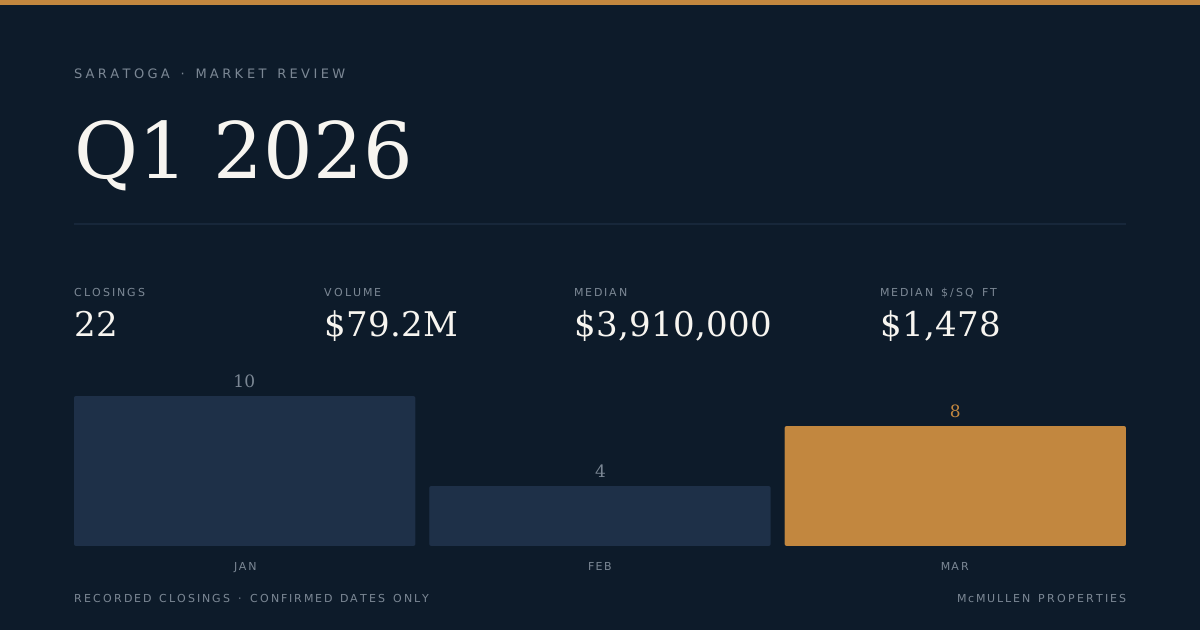
Saratoga Q1 2026: 22 Closings, $79.2M in Volume, and a $2,707/SF Outlier That Rewrote the Range
Twenty-two transactions closed across Saratoga in Q1 2026, spanning three segments and a price range from $960,000 to $5.55 million. The single-family segment carried the quarter, with a median of $4.2 million across 17 sales — while a 3-bedroom on Farwell Avenue posted the quarter's highest price-per-square-foot at $2,708.
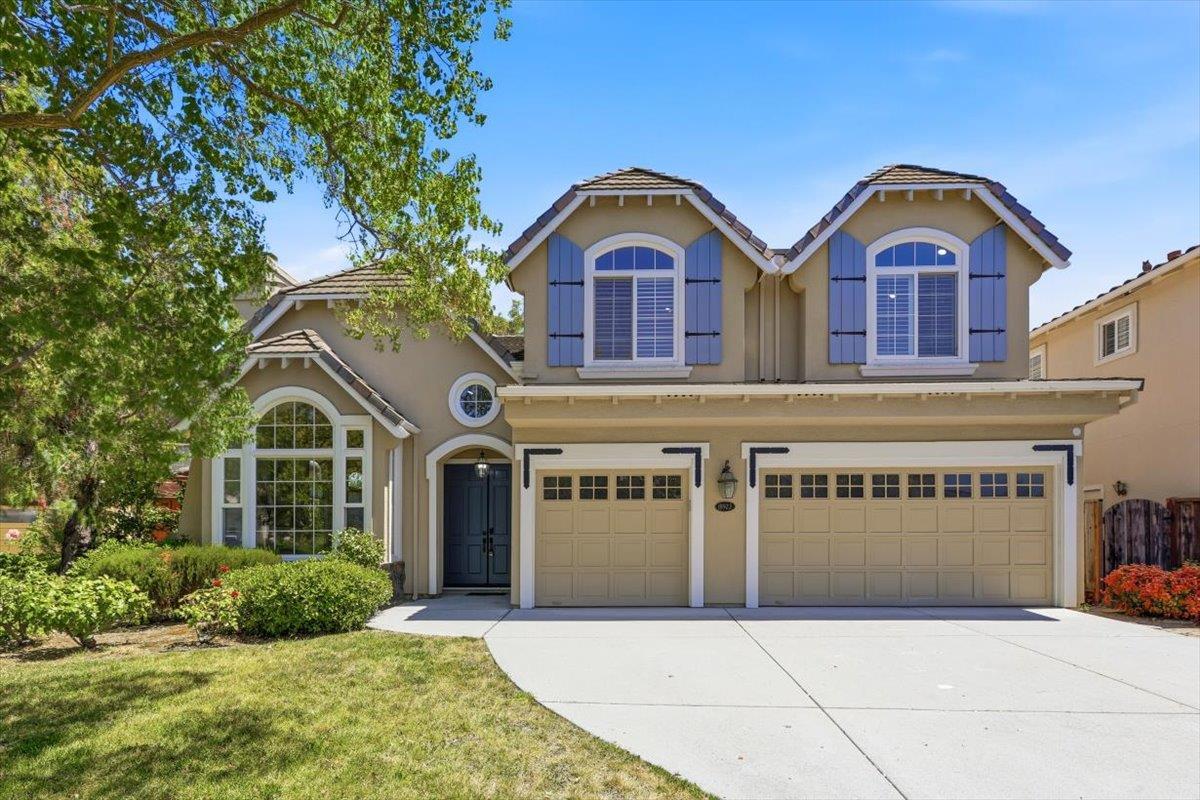
Back on the market 18 months after it last sold — at the exact same price
A Saratoga home recorded as sold in March 2025 for $4,700,000 is back on the market at $4,700,000. The owner is asking buyers to cover 17.7 months of carrying costs at no premium.